Updated Jun 26, 2020 There are different types of externalities. The definition above already suggests that they can be either positive or negative. Additionally, there is another (and maybe less familiar) distinction which should be made here: Both positive and negative externalities can arise on the production or the consumption side. In the following paragraphs, we will look at the different types of externalities in more detail. Economic activities that have positive effects on unrelated third parties are considered positive externalities. As we learned above, they may be present in the form of production or consumption externalities. Positive production externalities are positive effects that originate during the production process of a good or service. An example of this could be an orchard placed next to a beehive. In this situation, both the farmer and the beekeeper benefit from each other, even though from an economic perspective, neither of them has considered the other one’s needs in their decision-making. Positive consumption externalities are positive effects on third parties that originate from the consumption of a good or service. A possible example could be your neighbor’s flower garden. She probably cultivates the plants solely for her own pleasure, yet you can still enjoy the beauty of the flowers whenever you walk by. Negative production externalities are adverse effects that originate during the production process of a good or service. The most common example of this kind of externality is the pollution caused by firms during the production of their goods. Pollution affects the entire population; however as long as companies are not held accountable for it, they have no incentive to reduce their economic impact (because that would be more expensive). To illustrate this, we shall compare the social cost and social benefit again. Similar to the positive externality example, individual demand (D) represents social benefit (SB). The social cost curve (SC) in this case, however, is higher than the individual supply curve (S) because of the external cost (EC) that is not included in the firm’s supply decision. As a result, the market equilibrium (E*) is different from the optimal market situation (O*) and there is an oversupply of harmful behavior. In this example, the optimal price of the good (p2) is higher than its actual market price (p1). Negative consumption externalities are negative effects that arise during the consumption of a good or service. To give an example, we can revisit your neighbor. If she likes to play loud music in the middle of the night, a negative externality on your part could be sleep deprivation. Once again, she may not take this into account as the consequences do not directly affect her. Without any regulatory influence, neither the firm nor your neighbor will take the negative effects of their activities into account. They are not directly affected by the consequences and will thus produce more than the socially efficient amount (see also The Coase Theorem). This results in an excess supply of harmful behavior.Positive Externalities
Positive Production Externalities
This can be illustrated by comparing social cost and social benefit based on a supply and demand diagram. In our example, individual demand (D) is equal to social benefit (SB) since there are no externalities on the consumption side. However, social cost (SC) is lower than the individual supply (S) because there is an external benefit (EB) that is not included in the individual supply curve. As a result, the market equilibrium (E*) is different from the optimal market situation (O*) and there is an undersupply of both orchards and beehives.Positive consumption externalities

Positive consumption externality
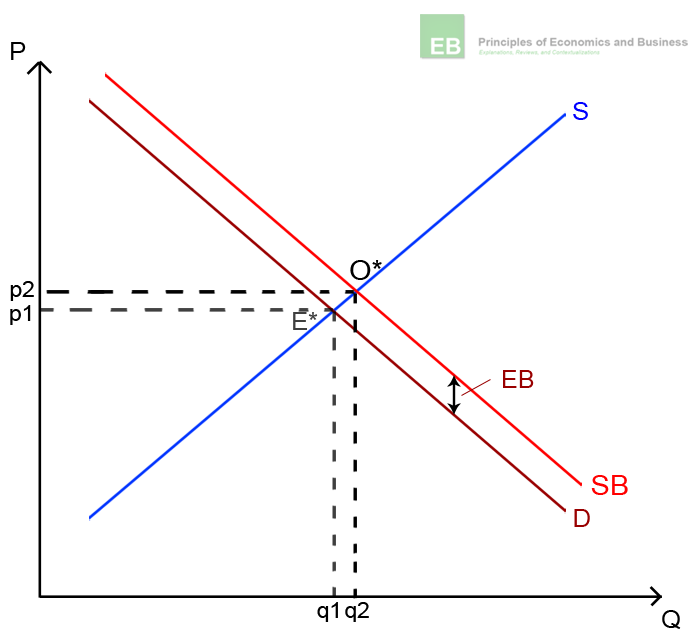
Again, this can be illustrated by comparing social cost and social benefit. In this case, however, the individual demand curve (D) lies below the social benefit curve (SB) because the external benefit (the beauty of the flowers to others) is not included in the neighbor’s demand curve. The social cost (SC) on the other hand is equal to the individual supply (S) because there are no externalities on the production side. Like in the first illustration, the market equilibrium (E*) is different from the optimal market situation (O*). As a result, there is an undersupply of flowers. Unlike in the previous example, this time, the optimal price (p2) is higher than the equilibrium price (p1).Negative externalities
Negative production externalities

Negative production externality Negative consumption externalities

Negative consumption externality
In this case, the individual demand curve (D) lies above the social benefit curve (SB) because of the external cost (your sleep deprivation) that is not included in the neighbor’s demand curve. The social cost curve (SC) on the other hand is equal to individual supply (S) because there are no externalities on the production side. Again, the market equilibrium (E*) is different from the optimal market situation (O*), and as a result, there is an oversupply of loud music. In this example, the optimal price of the good (p2) is lower than its actual market price (p1).In a Nutshell
Microeconomics
