
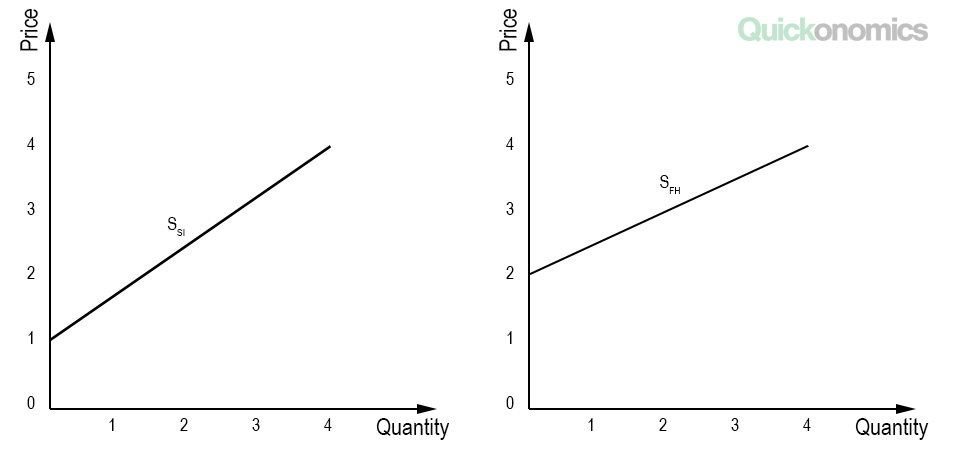
Updated Jun 26, 2020 In economics, supply is defined as the quantity of a specific good or service that producers are willing to provide over a given period of time. This definition looks at all producers combined (i.e. aggregate data). However, individual producers may be willing to provide significantly different quantities of any given good or service, depending on their individual costs, capacities and a number of other factors. Therefore, it is important to distinguish between two different types of supply: individual and market supply. We will look at them in more detail below. Individual supply describes the willingness of an individual firm to provide a specific quantity of a good or service to the market over a given period of time. It depends on a number of different factors, such as the price of the product, cost of production, government policies and regulation, etc. (for more information see also factors that cause a shift in the supply curve). In most cases (i.e. for normal goods) supply increases as the price of a good or service rises. This relationship between price and quantity can be illustrated with a supply curve (see also how to draw a supply curve). For example, let’s analyze the two diagrams below. They illustrate the supply of ice cream of two individual firms – Super Ice and Frozen Happiness. Super Ice’s supply curve (SSI) and Frozen Happiness’ supply curve (SFH) show us how much ice cream each of the two companies is willing to sell at different prices. Note that the two curves have different slopes. While Super Ice will start selling ice cream as soon as price is higher than USD 1.00, Frozen Happiness will only enter the market at a price higher than USD 2.00. However, at a price of USD 4.00 both companies are willing to sell 4 units of ice cream. To find out why the slopes are different, we would need to analyze a number of additional factors, including the firm’s production possibility frontiers.Individual Supply
Market Supply
Market supply describes the quantity of a specific good or service that all sellers in a market combined are willing to sell. In other words, it represents the sum of all individual supplies for a particular good or service. Again, this is much easier to understand once we look at the corresponding demand curve.
Let’s revisit our example from above. To calculate market supply, all we need to do is horizontally sum the individual supply curves of our two sellers (i.e. Super Ice and Frozen Happiness). This results in the following market supply curve (SM):
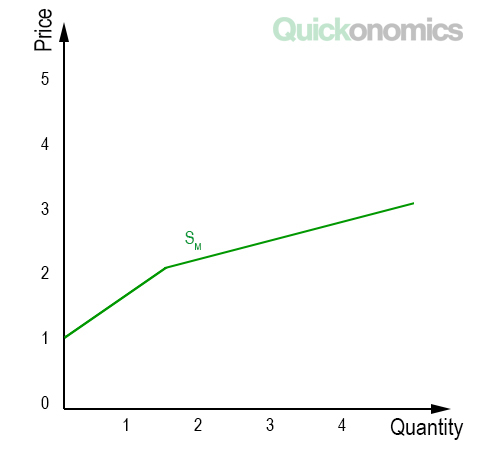
Note that this curve has a sharp bend at a price of USD 2.00. The reason for this is that Frozen Happiness will not sell any ice cream below that price. That means below USD 2.00 (and above USD 1.00) market supply is equal to Super Ice’s individual supply, because in this range it is the only supplier in the market. For all prices above USD 2.00 market supply is equal to Super Ice’s supply plus Frozen Happiness’ supply. For instance, at a price of USD 4.00 market supply is 8 units of ice cream (4 supplied by Super Ice and 4 by Frozen Happiness).
In a Nutshell
Supply is defined as the quantity of a specific good or service that producers are willing to provide over a given period of time. However, it is important to distinguish between two different types of supply: individual and market supply. Individual supply describes the willingness of an individual firm to provide a specific quantity of a good or service to the market over a given period of time. Meanwhile, market supply describes the quantity of a specific good or service that all sellers in a market combined are willing to sell (i.e. the sum of all individual supplies for a particular good or service).